How to Measure Your Hockey Games
Did I have a good or bad game?
When looking at game-to-game performance, ‘big picture’ stats like goals & assists can be misleading. While they are (obviously) important, they do not paint the full picture. There are a few reasons for that, including sample size, luck, and trusting results over process.
The Toronto Maple Leafs start to the 2021-22 season is a great case study for this dilemma. They started the season 2-4-1 start, but were leading the NHL in many key areas on October 27th, including:
Shot attempts
Slot shots
Cycle chances
Rebound chances
And on an individual level, key players such as William Nylander & Mitch Marner were at the top of the dangerous chances created-for and other key micro-stat charts. The Leafs ‘regressed back to the mean’ in a good way, and ripped off a dominant five-game winning streak.
Process Focus
Scott Gomez was on the Real Kyper & Bourne podcast and was talking about his time with legendary GM Lou Lamoriello and the New Jersey Devils.

He discussed the process to attaining consistently great results. Sometimes you do the right things and bad luck gets in the way. But as we all intuitively know, doing the right things over and over lead to favorable results (e.g. law of averages, regression to the mean, etc.).
Further reading - Evaluating your process rather than your results
Micro Statistics
Micro statistics are a much better way of measuring game performance and process. They can also do a much better job at showcasing which players are likely to continue to produce fruitful results in the future, which are likely to break out of a slump, and which players are due for some regression.
Some micro-stat examples:
Chances for/against
Battles won vs lost
Controlled Zone Exits
Denied Zone Entries
Game score
From these micro-stats, we can get a better idea of how players performed in given games. This is particularly illuminating for players that may not be large point scorers.
These game scores can be transformed into something intricate, like expected goals (xG), or broken down into simpler metrics, like turnover ratios.
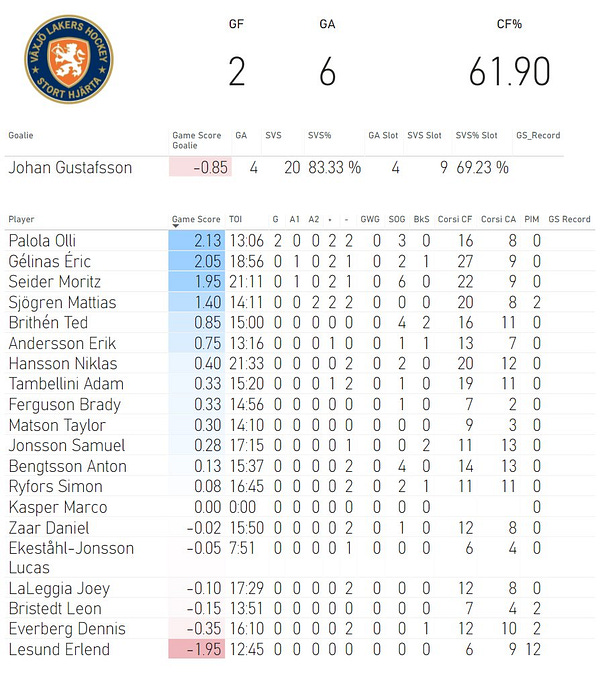
Over in Sweden, @BetterThanAMonkey does a game score for SHL games. Each category is scored, weighted, then totaled to give a picture of how each player performed.
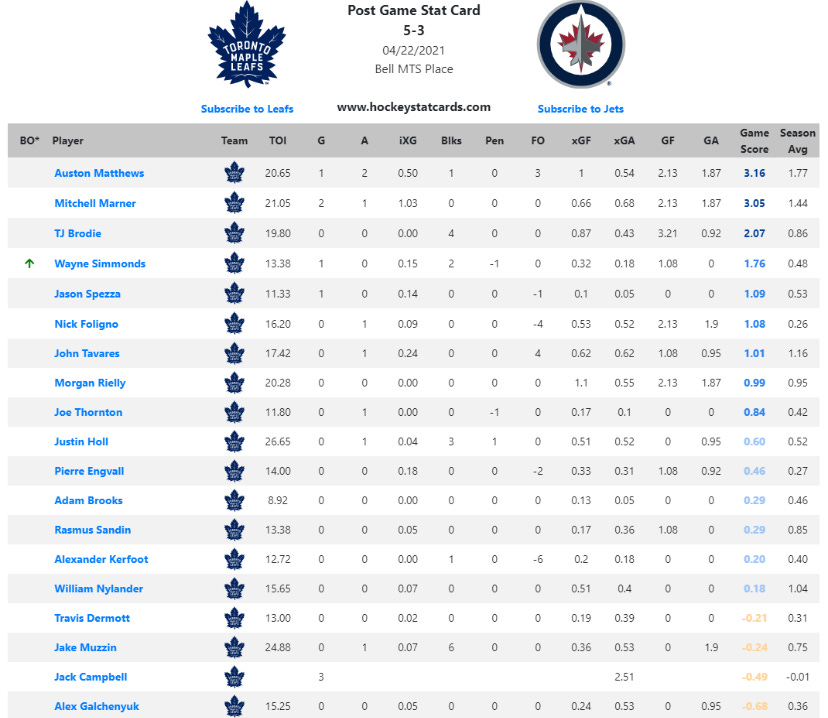
Here’s another example from HockeyStatCards.com:
The Athletic’'s Dom Luszczyszyn uses a similar process in his Game Score.
Puck touch sheet
Personally, I try to stay away from points and focus on more specific events. Thus attempting to focus on the process over results.
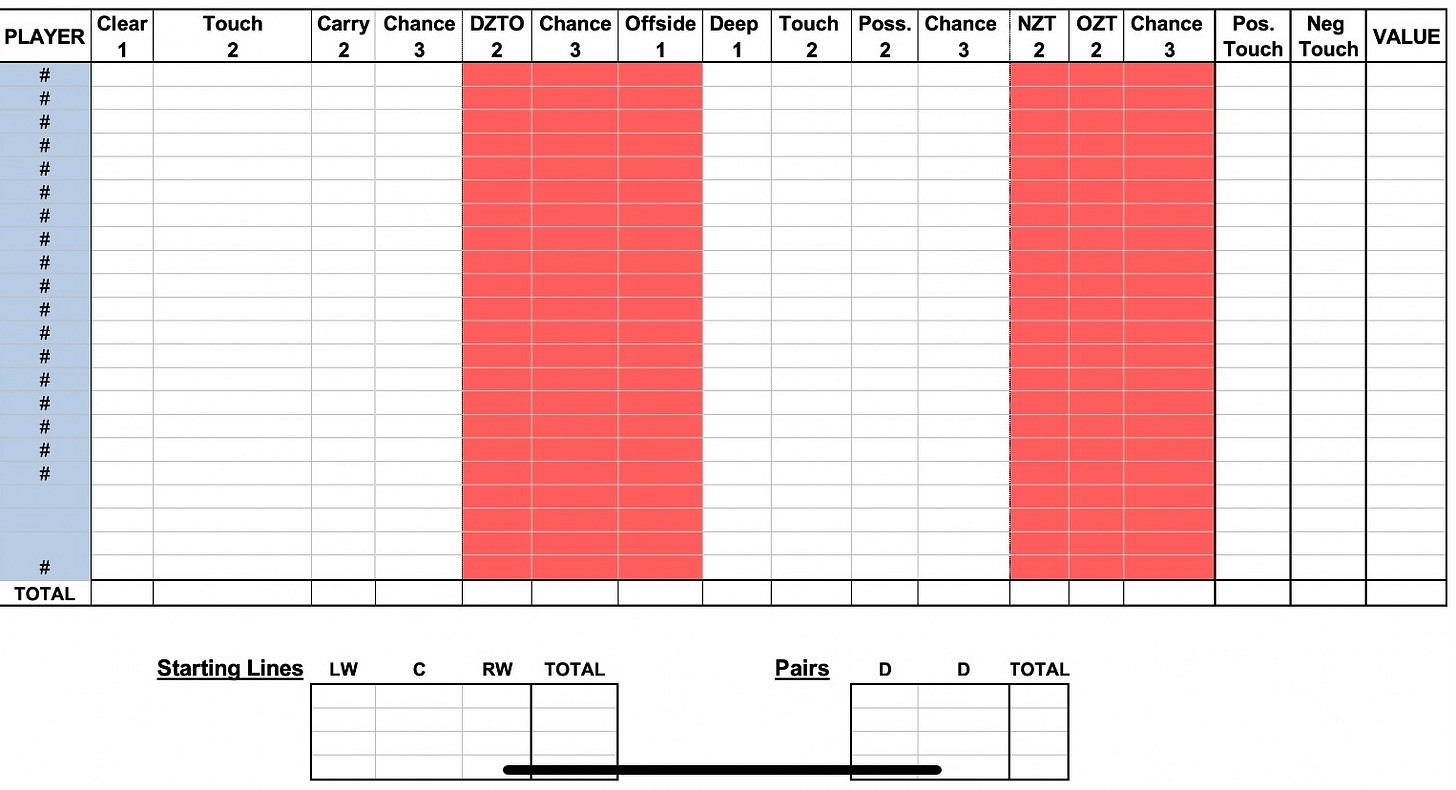
At a high level, I start with a puck-touch sheet. Here is a sample from a game this past season:
The Columbus Blue Jackets have their own puck touch sheet. Here is what it looked like from the 2019-20 season:
If you’d like my empty spreadsheet, you can purchase it here for $5.
Going Beyond
Whether you’re a coach, player, or fan, next time you reflect on a game, we encourage you to go beyond the scoresheet’s stat line and dig deeper.
Further Reading - Improving your team play
Did you enjoy this newsletter?
Help us spread the ideas within and share it with the people you care about


