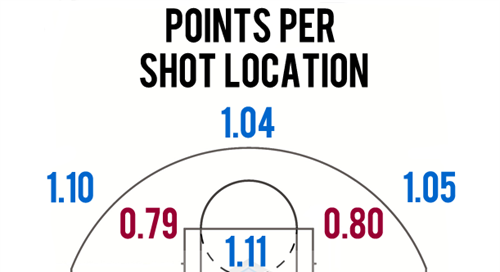
Like any other sport, hockey is an ever-changing game. Thanks to work done in the public space, we now know definitively that there is a strong correlation between proximity to the net and shooting percentage.
And while this concept also holds true in basketball, we see more than ever that basketball teams are electing to shoot from further distances in search of a greater reward.
Basketball’s Three-Point Shot
In 1961, the American Basketball League (ABL) became the first league to institute the three-point rule. Their goal was to increase the entertainment level. The ABL shut down in 1963, though the NBA ended up adopting the rule beginning in the 1979-80 season. That season, teams on average went 0.8/2.8 in three-point shooting per game.
Today, it’s a different story. In 2019-20, there were over 34 attempts per game with over 12 being made. To say the sport has changed over the past 40 years would be a dramatic understatement.
As you may expect, this change didn’t happen overnight. Roughly speaking, in every 10-year increment, the average amounts of three-point shots attempted and made doubled.
NBA Shooting locations
Owen Phillips, a contributor at the data-driven website FiveThirtyEight posted the below charts. The first shows shot locations from the 2006-07 NBA season. The second is the 2019-20 shot locations. As we can see, 2006-07 was filled with shots from all over the court.
In 2019-20, the mid-range shot has all but disappeared. Today’s NBA is fairly binary, with either down-low post plays/transition lay-ups) or three-point shots taking up the lions’ share of all shot attempts. Teams are clearly going out of their way to pass on everything in-between.
Teams have realized there is an inefficiency in shooting mid-range shots. Why take a mid-range shot when you can step back a few feet back, largely keep the same shooting percentage, and tally an additional point per shot?
To best understand efficiency and incentives, we can break down each shot by their expected points per shot. For example, mid-range shots are worth 0.8 (40% x 2pts) points, much less than three-point shots or shots from the key.
Points per possession (offensive efficiency) have been on the rise in the NBA. Almost every year, there is a new all-time high due to teams implementing better scoring tactics.
Bringing It Back To Hockey
Hockey doesn’t have three-point shots, so there is less incentive to take these long-range shots.
Micah Blake McCurdy of HockeyViz.com routinely puts out charts showing the shot locations and rates of players and teams. Inspired by the above shot charts, he released a chart comparing the 2007-08 season to the 2019-20 season. Red indicates a higher volume of shots, while blue shows a lesser shot volume.
Teams today realize that shots from close distance are vital to success (refer back to the graphic at the top of this piece). Still, teams today appear to be misguided by the efficiency of the shots they are taking at longer ranges.
Behind the times?
McCurdy’s chart is curiously similar to the 2019-20 NBA chart. There’s a higher volume of in-tight shots and shots from the point, but fewer mid-range shots. In hockey though, teams and players are incentivized to shoot from the home plate/ house area of the ice.
We’ve discussed this concept before in our piece relating to Shot Quality vs Shot Quantity. And while it’s easy to suggest that perhaps NHL defenses are simply more skilled today at defending the high-danger areas, McCurdy’s chart suggests that there is significantly more shot volume in the most dangerous part of the ice… directly in front of the goal.
Case Study: Tampa Bay Lightning
An astute follower of McCurdy’s asked, “What about Tampa Bay?” Well, let’s just say they are currently better and smarter than everyone else…
Tampa won the Stanley Cup by taking fewer point shots and prioritizing shot quality. While the rest of the NHL has seen an uptick in shot volume in front of the net and from the corner of the blueline, the Lightning have found success with mid-range shots, almost completely eschewing the high-danger area directly in front of the net.
The NHL is a copycat league, so we’re bound to see teams try to replicate the Tampa Bay model. Is this a trend that other teams can replicate? Or are the Lightning able to pull this off due to their plethora of high-end players? Regardless, it will be fascinating to see how shot trends continue to evolve as the data revolution continues to change the way all sports are played.
Related reading - How does Zach Werenski score goals?
Did you enjoy this newsletter?
Help us spread the ideas within and share it with the people you care about


